Plot method for a discharge rating curve tournament
Source:R/tournament_methods.R
plot.tournament.RdCompare the four models from the tournament object in multiple ways
Usage
# S3 method for class 'tournament'
plot(x, type = "tournament_results", transformed = FALSE, ...)
Arguments
- x
An object of class "tournament"
- type
A character denoting what type of plot should be drawn. Possible types are:
boxplotCreates a boxplot of the posterior log-likelihood values, on the deviance scale.
rating_curvePlots the rating curve.
rating_curve_meanPlots the posterior mean of the rating curve.
fPlots the power-law exponent.
sigma_epsPlots the standard deviation on the data level.
residualsPlots the log residuals.
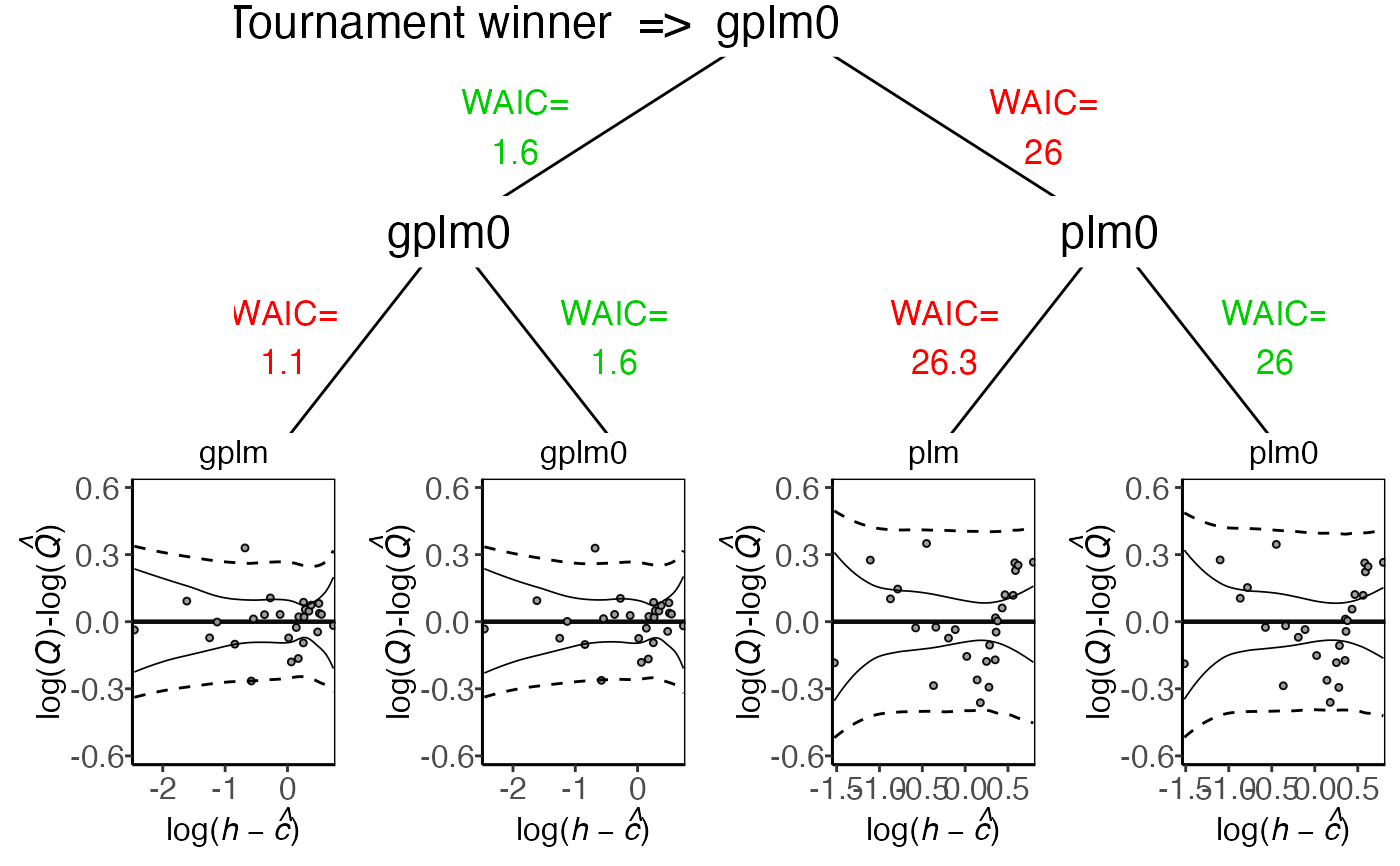
tournament_resultsPlots a diagram showing the tournament results.
- transformed
A logical value indicating whether the quantity should be plotted on a transformed scale used during the Bayesian inference. Defaults to FALSE.
- ...
Not used in this function
See also
tournament to run a discharge rating curve tournament and summary.tournament for summaries.
Examples
# \donttest{
data(krokfors)
set.seed(1)
t_obj <- tournament(formula = Q ~ W, data = krokfors, num_cores = 2)
#> Running tournament [ ] 0%
#>
#> Progress:
#> Initializing Metropolis MCMC algorithm...
#> Multiprocess sampling (4 chains in 2 jobs) ...
#>
#> MCMC sampling completed!
#>
#> Diagnostics:
#> Acceptance rate: 25.33%.
#> ✔ All chains have mixed well (Rhat < 1.1).
#> ✔ Effective sample sizes sufficient (eff_n_samples > 400).
#>
#> ✔ gplm finished [============ ] 25%
#>
#> Progress:
#> Initializing Metropolis MCMC algorithm...
#> Multiprocess sampling (4 chains in 2 jobs) ...
#>
#> MCMC sampling completed!
#>
#> Diagnostics:
#> Acceptance rate: 31.14%.
#> ✔ All chains have mixed well (Rhat < 1.1).
#> ✔ Effective sample sizes sufficient (eff_n_samples > 400).
#>
#> ✔ gplm0 finished [======================== ] 50%
#>
#> Progress:
#> Initializing Metropolis MCMC algorithm...
#> Multiprocess sampling (4 chains in 2 jobs) ...
#>
#> MCMC sampling completed!
#>
#> Diagnostics:
#> Acceptance rate: 25.66%.
#> ✔ All chains have mixed well (Rhat < 1.1).
#> ✔ Effective sample sizes sufficient (eff_n_samples > 400).
#>
#> ✔ plm finished [==================================== ] 75%
#>
#> Progress:
#> Initializing Metropolis MCMC algorithm...
#> Multiprocess sampling (4 chains in 2 jobs) ...
#>
#> MCMC sampling completed!
#>
#> Diagnostics:
#> Acceptance rate: 36.04%.
#> ✔ All chains have mixed well (Rhat < 1.1).
#> ✔ Effective sample sizes sufficient (eff_n_samples > 400).
#>
#> ✔ plm0 finished [================================================] 100%
plot(t_obj)
plot(t_obj, transformed = TRUE)
 plot(t_obj, type = 'boxplot')
plot(t_obj, type = 'f')
plot(t_obj, type = 'sigma_eps')
plot(t_obj, type = 'residuals')
plot(t_obj, type = 'tournament_results')
plot(t_obj, type = 'boxplot')
plot(t_obj, type = 'f')
plot(t_obj, type = 'sigma_eps')
plot(t_obj, type = 'residuals')
plot(t_obj, type = 'tournament_results')
 # }
# }